
Performance
Open the Dash and pick PERF. The panel puts two things on one surface: what your headset was doing, and what your PC was doing while it did it. Every desktop tool can show you a CPU history and the process on top of it, but none of them knows what the compositor was doing that second — and taking the headset off is how you lose the stutter you were chasing.
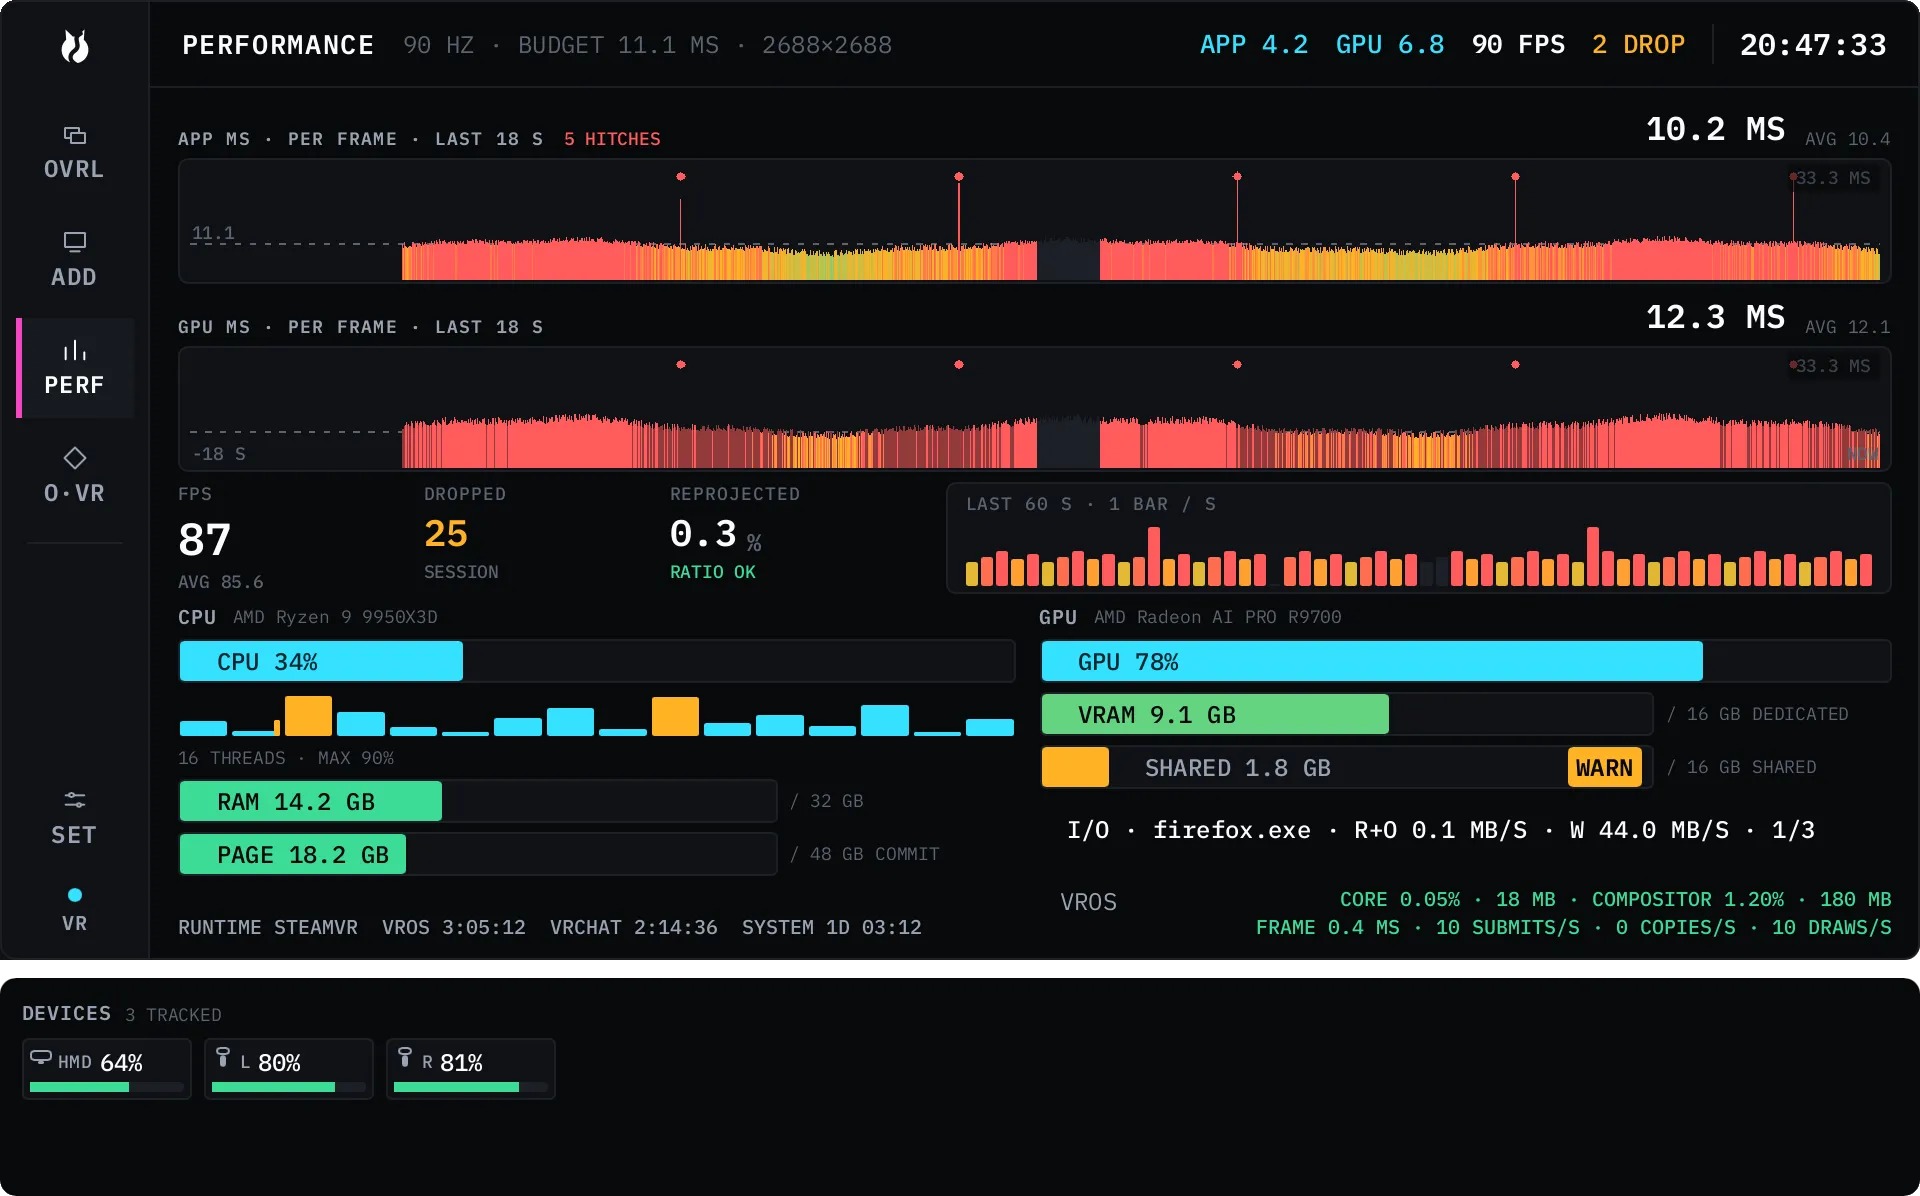
Four arrangements of the same data ship: STRIPS (the default), CLASSIC, CONSOLE, and MAGNIFIED (oversized, for reading at wrist distance). Switch in Settings under General, Performance area, Layout. The rest of this page uses the STRIPS names.
The frame strips
Section titled “The frame strips”Two per-frame graphs sit at the top: APP MS · PER FRAME · LAST n S and
GPU MS · PER FRAME · LAST n S. One frame is one pixel, so the window holds as
many frames as the strip is wide, and the label says how many seconds that
works out to at your refresh rate. A dashed line marks the frame budget for
your headset. Frames drawn dim come from stretches where vrOS itself was not
rendering at full pace — they are shown rather than hidden, and left out of the
FPS and AVG figures rather than faked.
A hitch marker is a dot on both strips at the same frame. A frame counts as a hitch when its peak — the larger of the app frame interval and total GPU time — is at least 1.5 times the median of the last 45 frames and at least 5 ms above it. That is a ratio against what your machine was just doing, not a fixed threshold, so a steady 40 fps world produces no markers and one spike in a smooth one does. The strip header counts them over the window.
Under the strips in the STRIPS layout, LAST 60 S · 1 BAR / S holds one bar
per second for the last minute, red where that second held a hitch. Point at a bar, or walk to the
graph with a gamepad, and it names the process that used the most CPU during
that second. Bars from before you opened the panel carry no name: the frame
history folds continuously while the headset is attached, but the process stamp
only exists while a dash is open.
CPU, cores, and driver time
Section titled “CPU, cores, and driver time”The CPU meter carries the total and your CPU’s model name. Under it sits one
bar per logical processor, captioned n THREADS · MAX p%. The grid wraps to
any thread count, and MAGNIFIED is the one layout without it.
Each core cell can also grow a narrow second bar: DPC plus interrupt time, the work that core spent inside a driver. It has its own fixed 0 to 25 percent scale, so half height is about 12 percent, and it is absent entirely at zero — on a healthy machine most cores draw nothing and a hot one stands out by contrast. It is drawn only where cells are wide enough to hold it, so the CONSOLE layout and very high thread counts show the busy bar alone.
Driver time on one core means the suspect is a driver, not the app on screen. On the machine this was measured on, one core carried 5 to 12 percent driver time continuously with nothing running but SteamVR — while its busy bar read 9.23 percent, so half of that core’s load was deferred driver work that a plain busy percentage draws as an unremarkable short bar. Plug or unplug a USB device, or start a large file copy, and you can watch the figure move.
Two things to know before acting on it:
- Most cores reading
DPC 0%is correct. The accounting quantum is 15.625 ms, so at one sample per second the figure steps in jumps of about 1.5 points and a quiet core reads exactly zero. - The two bars do not share a scale. Busy runs 0 to 100, driver runs 0 to 25, so a short busy bar can sit beside a taller driver bar. Read the numbers before concluding anything.
Point at a core for CORE i · p% · DPC d% · ISR n%. Point at the CPU meter for
the system totals and the current top process on one line. On Linux the same
two figures come from /proc/stat. Where a platform cannot supply them the
terms are dropped from the readout rather than shown as zero.
Memory, GPU, and the spill meters
Section titled “Memory, GPU, and the spill meters”| Meter | Shows | Amber / red |
|---|---|---|
| RAM | used against installed | 85% / 92% |
| PAGE | commit charge against the commit limit | 85% / 92% |
| GPU | adapter busy percentage, with the model name | — |
| VRAM | dedicated video memory used against total | 85% / 92% |
| SHARED | shared system memory used against total | see below |
SHARED is the meter that catches VRAM spilling into system memory, which is one reason a game suddenly runs at half speed. It raises a word only once dedicated VRAM is at least 95 percent full, and then at 0.5 GB spilled it warns and at 2.0 GB it errors. Shared use below that gate is normal and is not flagged.
Any meter whose counter your machine does not expose reads —. That is an
honest absence, not a zero.
The rest of the panel
Section titled “The rest of the panel”- The tiles. FPS with a rolling average, APP MS, GPU MS, DROPPED for the
session, and REPROJECTED as a session ratio —
RATIO OKat or under 1 percent,RATIO HIGHabove it. - The I/O row. The busiest process by disk traffic, read plus other and
write, with
1/3showing which of the ranked processes you are looking at. Activate the row to cycle through them. - Uptimes.
VROS, the running game, andSYSTEM. The vrOS figure is the core process’s own, so restarting the compositor does not reset it. Past a day it reads as1D 03:12. - The vrOS cost row. Core and compositor CPU and memory, the compositor’s frame time, and its submits, copies, and draws per second. At idle it reads zeros, which is the point.
- The devices band. A separate strip of the Dash canvas with a chip per tracked device — HMD, L, R, then trackers, up to 20 with the true count in the title — each carrying a battery percentage that turns amber at 50 and red at 25. Point at a chip for its model and serial. Turn the band off, or put it above the panel instead of below, in Settings → General.
Everything a hover shows is also reachable with a gamepad: walking the panel opens the readout for the element that matters rather than making you visit 32 bars.
What it costs
Section titled “What it costs”| What | How often it updates |
|---|---|
| Frame strips | 10 times a second, only while PERF is the active area |
| Tiles, meters, history bars, uptimes, clock | once a second |
| Battery levels | once every 5 seconds |
| Process table (I/O row, top process) | once every 2 seconds, while a dash is shown |
| Everything, while the Dash is hidden | not at all |
Frame timing itself is read once per compositor frame from data vrOS already has in hand, which is why the last 60 seconds are real the moment you open the panel instead of starting when you looked. The process table is the only system-wide scan, and it is one switch: Settings → General, Performance area, Process monitor. Turn it off and the I/O row and the top-process names go away and the read never happens.